| - Which datastores are running “hot”?
- Which hosts/hypervisors have the highest storage latency?
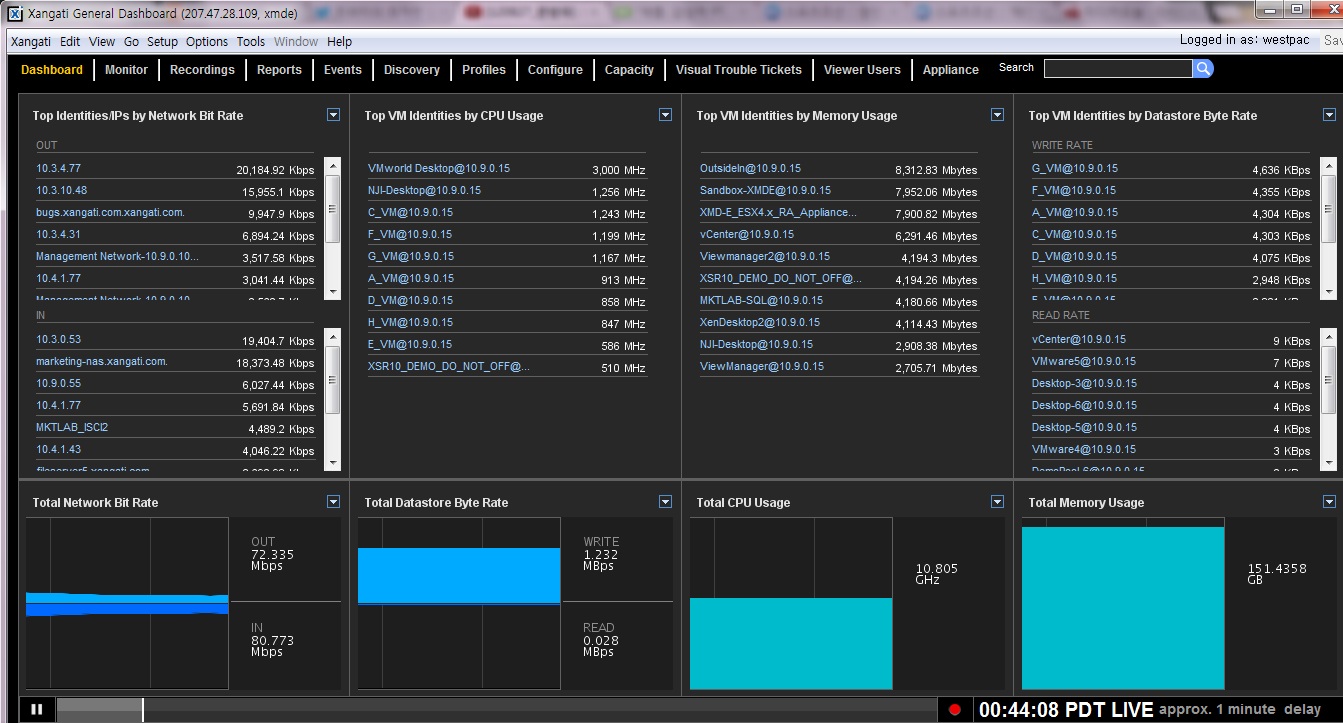
- Which VMs are using the most memory?
- What applications and desktops are running in which VMs?
- Which processes are driving the guest VM to suboptimal performance?
- Where are the virtual and physical network bottlenecks?
- Who is using what application?
With Xangati’s VI and VDI Dashboards, you troubleshoot, design, and optimize your infrastructure to overcome stall and accelerate your virtualization initiatives:
- Save time by troubleshooting performance problems up to 10X faster with live, dynamic drill-down navigation showing actual activity, instead of averages.
- Design superior deployments using virtual and physical communication profiles and extensive storage latency, CPU, and memory statistics.
- Reduce costs by optimizing performance with live physical and virtual communications presented in the same pane of glass.
Xangati Management Dashboard (XMD) Product Suite includes the leading Infrastructure Performance Management Solutions for VI and VDI:
- Xangati VI Dashboard provides a way to track all the virtual and physical infrastructure components?including applications? that affect VI performance. The VI dashboard leverages Xangati’s unique performance health engine to keep an administrator apprised of the real-time health of his infrastructure without requiring software agents
- Xangati VDI Dashboard is the industry’s first solution to comprehensively track all key infrastructure components that affect VDI performance. The VDI dashboard leverages Xangati’s unique performance health engine to keep an administrator apprised of the real-time health of his infrastructure without requiring guest-level software agents.
Deployment
Xangati Management Dashboard (XMD) products deploy easily as either virtual appliances (OVF files) or as a physical appliance for scalability. An XMD virtual appliance deploys in minutes and gathers data feeds from a variety of different sources including vCenter, Windows Management Interface, from Xangati’s Flow Summarizers (XFS) residing on specific ESX(i) servers and from NetFlow. Netflow is a way that Xangati can track activity on the physical network and is also a means to get information traversing virtual distributed switches either from VMware (vSphere 5 and beyond), Cisco and Citrix.
|