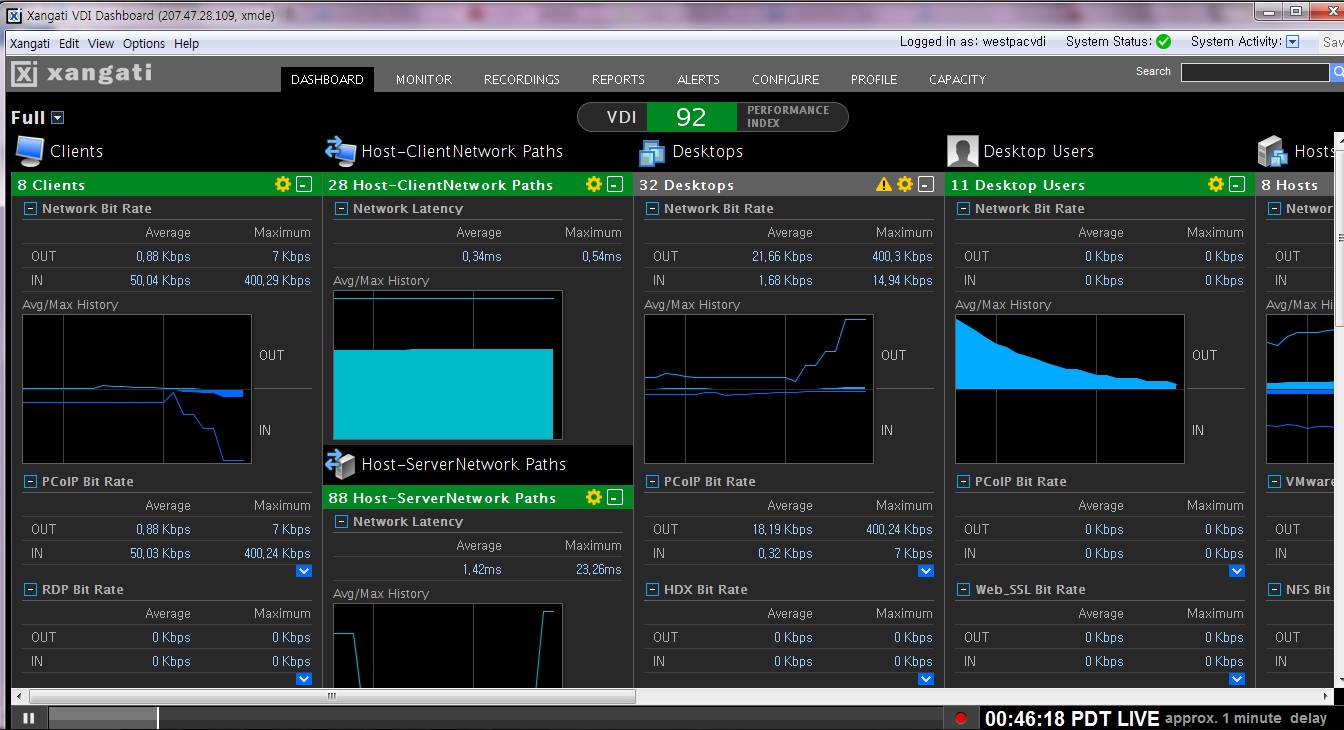
| The VDI dashboard leverages Xangati’s patent-pending performance health engine to keep an administrator apprised of the real-time health of his infrastructure without requiring software agents.
The Xangati VDI dashboard is differentiated from competing performance management solutions in the following ways:
- 3600 Infrastructure Performance Management?Cross silo interaction tracking all infrastructure affecting VDI performance
- Health index updated live and continuously
- Alert recordings provide context to performance issues
- Deep visibility into desktop VM processes with no guest-level agents required
- UI optimized for VDI administrator workflow
- End-user driven problem recordings
- Support for VMware View and Citrix XenDesktop
- Scales to 250,000 objects (desktops and/or clients)
As a result, the VDI dashboard provides admins benefits across the entire VDI lifecycle
- For assessments: Identifies which remote networks can support VDI
- For proof of concepts: Uncovers toxic interactions that can side-track project
- For production pilots: Closes the loop on end-user experience issues
- For scaling deployments: Alert recordings showing in which silo the problem resides (e.g. network, storage, etc.)
|